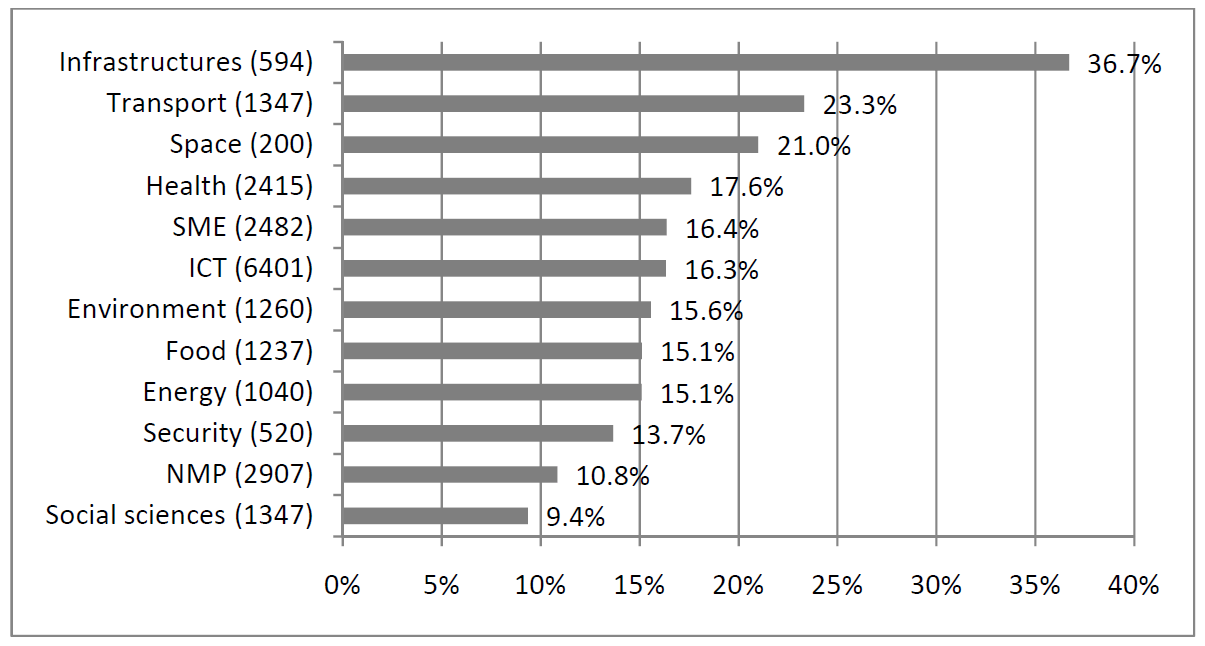
The latest Singleimage bulletin includes the following useful chart showing average success rates across a number of collaborative research programmes in FP7:
This shows data from calls where evaluation and selection had been completed by the end of 2009. It includes data from two-stage calls, where the success rate is calculated by dividing the number of successful proposals by the number submitted at stage 1. Research infrastructures proposals are usually submitted by expensive infrastructures and facilities, which are relatively few, so this accounts for the high success rates here. NMP’s (nanotechnologies, materials and production technologies) low success rate can be attributed to their high use of two-stage calls for proposals, but Social Sciences and Humanities don’t use these – the SSH success rate is just very low.
It should be borne in mind that these are average success rates, and UK participants usually do better than average.

